First, a disclaimer: The following statements were based off graphs I created using data from six broad academic disciplines. The data all comes from the 2008 digest published by the National Center for Education Statistics.
After spending weeks of my life preparing applications, essays, and letters alongside taking a standardized test and participating in a game of formal introductions and requests I was left wondering how many people end up going through with the whole experience. Just the act of applying for graduate school is exhausting. Statistics on how many enter and finish their graduate degrees to completion could be interesting, but I found information on total degrees conferred readily available in a report by the National Center for Education Statistics.
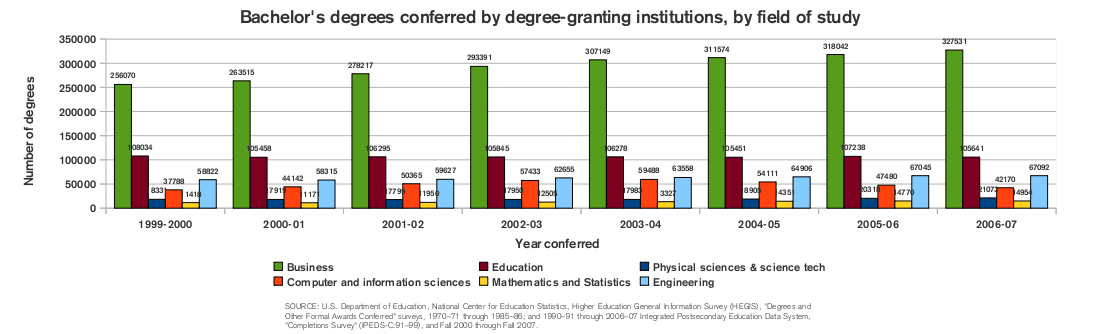
The report is quite sizable. If you're just in for a good summary, avoid any of the tables and focus on reading the text and making note of the figures. What I found most striking was what I perceived to be amazingly low numbers for fields like mathematics, physical sciences, and computer science. For example, only 21,703 people received a degree in the category of physical sciences and science technology in 2006-07. That's for the entire country. The primary disciplines that fall under this category are chemistry, physics, and earth science.
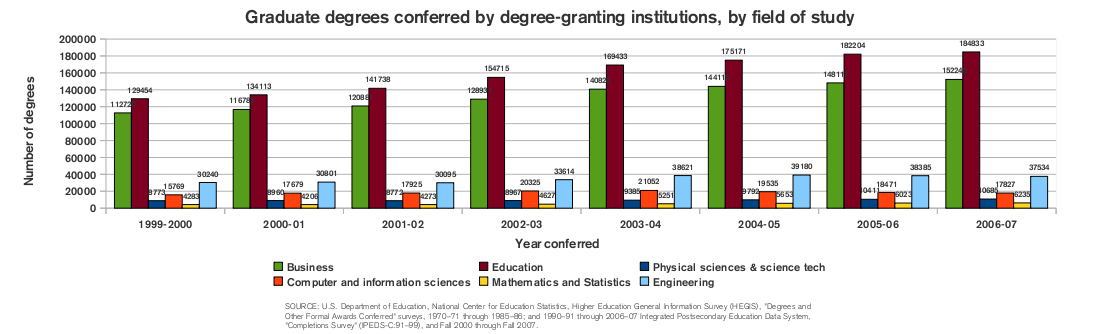
The picture isn't much different for graduate degrees (masters and doctoral). The most interesting data is that of the number of graduate degrees conferred in education. The number is consistently and substantially larger than the number of undergraduate degrees conferred for the same year (and that of the previous).
It is even more interesting to explore the trends of the relative amount of degrees conferred. By looking at a proportion rather than the total number, it's possible to see changes in the choice of discipline made by students. First, let's look at the trends in the proportion of bachelor's degrees conferred.
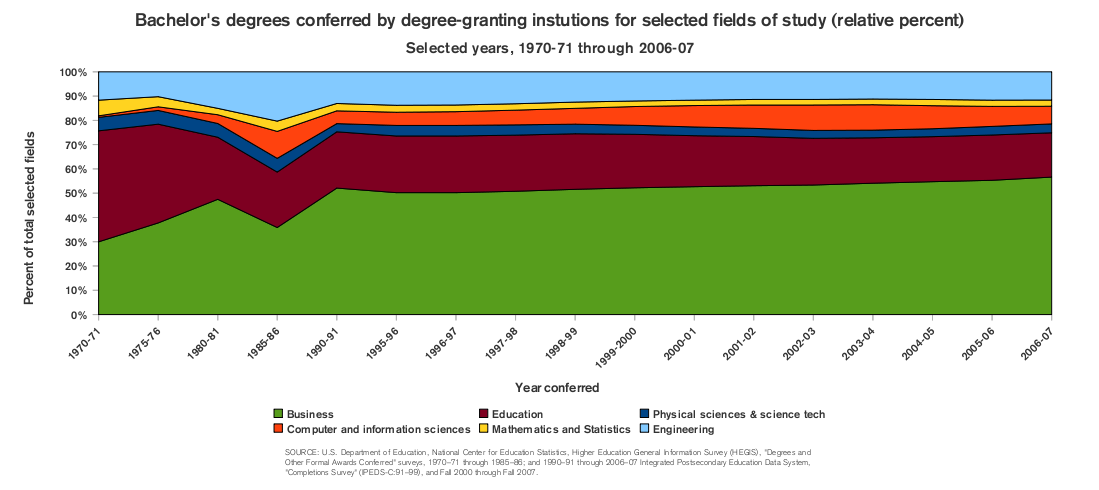
From 1971-1981 it appears that the proportion of students choosing to seek a business degree has increased steadily at a relatively constant rate. The proportions of undergraduate students receiving education degrees has contracted, physical sciences and technologies has remained stable, mathematics and statistics has shrunk, and engineering has grown. Then, there is a period in 1985-86 where the number of computer and information sciences and engineering degrees grew, but subsequently retracted. From 1995-96 onward, the proportions change very little. There is a slight bulge in computer and information science degrees in the early 2000's which declines starting around 2003-04.
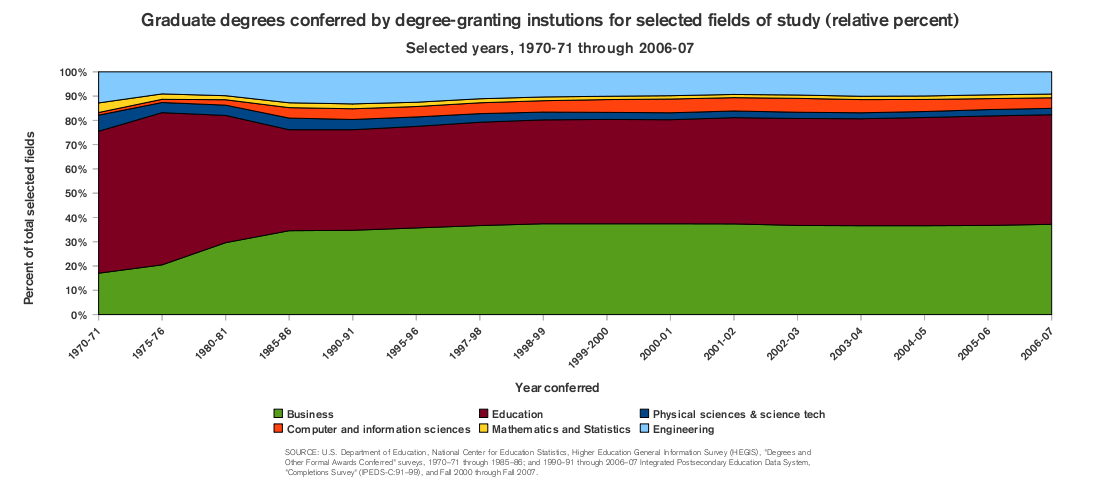
Comparing proportions of graduate degrees conferred is less exciting. Other than the expected growth of the proportion of business degrees and the shrinking of the proportion of education degrees leading up to the 1990's, the proportions are amazingly stable from the 1990's onward.
In a country of 300 million people, it's almost staggering to think how few students receive degrees each year. It would seem that there are so many universities that have so many students that there must just be gaggles of students receiving degrees across the nation in just about every discipline. It often feels like that to new graduates searching for a job, at least. The numbers tell a different story. Consider that the number of students that receive degrees in mathematics, statistics, and physical sciences each year could fit into a moderately sized rural town. During 2006-07, 1351 people received a doctorate in mathematics or statistics, 2029 in business, and only 1595 in computer and information science. While this last statistic isn't evident in the previous graphs, you can see it in the OpenOffice.org Spreadsheet I made. A PDF is also available of the graphs to provide more clarity.